The TurboTenant Rental Trends report continues to expand to include analysis for the last four weeks, ending on April 26th. We compare four key data points. The goal is to get a better understanding of how the coronavirus outbreak continues to impact various rental markets across the U.S, we will continue our analysis through the end of April and May as cities and counties across the country begin to open.
Data
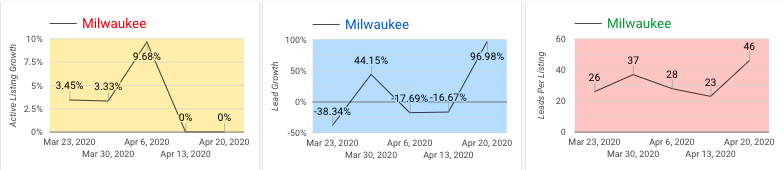
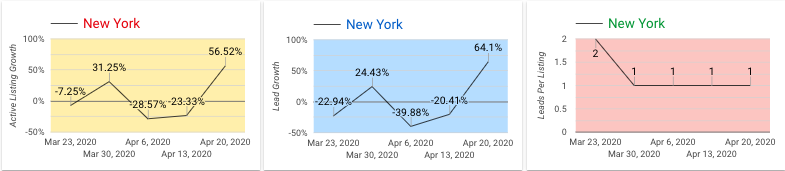
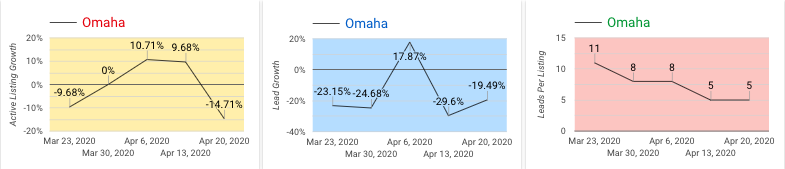
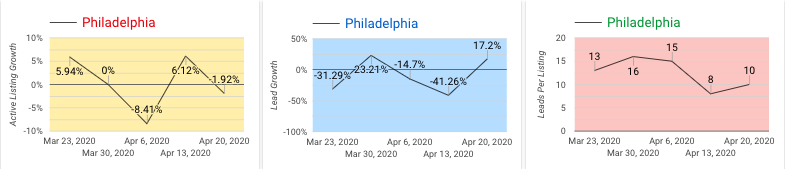
The TurboTenant Rental Trends report includes four key rental market indicators. Our first data set is total active listings. This analysis looks at the change in the total number of active listings in each location on a week over week basis beginning the week of March 23rd and ending on Sunday April 26th. The next data set we looked at is the total number of new listings for the first week of March, before most cities were on lock down, compared to the total number of listings for the week ending April 26th. In a pre-coronavirus world historically these numbers have increased as we enter the peak rental season starting in April. Our third data point is total renter leads. Here we analyze the change in the number of renter leads each location reported. Our final data point is the average number of renter leads each property receives. Again, we analyze the reported change on a week over week basis.
Below, we break down the trends reported for 19 major cities across the country.
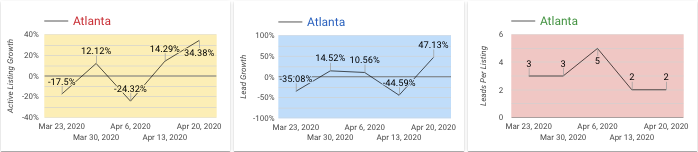
Active Listings: Atlanta’s active listings are on the rise reporting nearly a 35% increase this week.
New Listings: This is the first time in nearly two weeks a loss was reported in new listings clocking in with a 17% decrease since the beginning of March.
Renter Leads: Atlanta renter leads saw a great increase this reporting period with nearly a 50% increase.
Average Renter Leads Per Property: Average renter leads per property head steady this week at two.
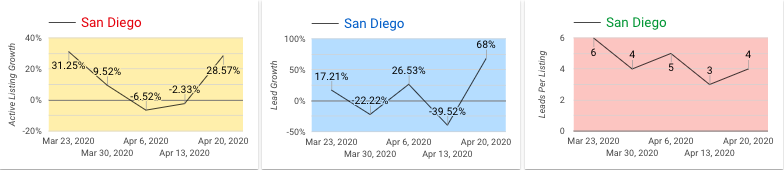
Active Listings: San Diego active listings posted a nice increase of nearly 30% week over week.
New Listings: 6% net gain in listings since the beginning of March.
Renter Leads: San Diego renter leads saw a great gain this week of nearly 70%.
Average Renter Leads Per Property: San Diego’s leads slowly decreased during March and April and recovered by one this week, ending at four leads per property.
You can view all data visualizations here. If you have data requirements that are outside the scope of this article, please email [email protected]. We have a plethora of data and are happy to supply another data set if it is available.
Creative financing can offer real estate investors options beyond traditional lending from banks. If you have less-than-ideal credit or lack a sizeable...
Creative financing can offer real estate investors options beyond traditional lending from banks. If you have less-than-ideal credit or lack a sizeable...
If you came here wondering how to write a lease agreement, look no further. Creating iron-clad rental contracts is essential for protecting the rights...
Join the 700,000+ independent landlords who rely on TurboTenant to create welcoming rental experiences.
No tricks or trials to worry about. So what’s the harm? Try it today!


![Beyond Traditional Loans: 14 Creative Financing Options for Real Estate Investing [Eugene]](https://www.turbotenant.com/wp-content/uploads/2025/02/creative-financing.jpg)